Ever feel overwhelmed by the constant need to check stock prices on various websites? What if you could automate this process, saving time and effort while getting the real-time updates you need?
In this article, I’ll show you how to build your own custom stock monitoring tool using web scraping. We’ll focus on scraping stock prices from MarketWatch for companies like Apple, Samsung, and Tesla.
By the end of this guide, you’ll have a powerful solution that collects and organizes stock data and uses ScraperAPI to ensure continuous and reliable scraping. This way, you can spend less time on manual checks and more time making informed investment decisions.
Technical Setup
The first step is to set up a virtual environment to get started. This ensures that your project dependencies are managed separately from your system’s global Python environment.
Here’s how you can do it:
1. Install virtualenv: If you don’t have it installed yet, install it using pip.
pip install virtualenv
2. Create a Virtual Environment: Navigate to your project directory and create a virtual environment.
virtualenv venv
3. Activate the Virtual Environment:
On Windows:
.\venv\Scripts\activate
On macOS and Linux:
source venv/bin/activate
4. Install Necessary Packages: With your virtual environment activated, you can install all the required packages for this project, including BeautifulSoup. You can find more detailed instructions on setting up and using BeautifulSoup in our Beautiful Soup Web Scraping guide.
Setting up a virtual environment ensures that your project’s dependencies are isolated, making it easier to manage and maintain. Now, let’s move on to analyzing the website’s HTML structure.
Analyzing the Website’s HTML Structure
Before we can start scraping stock prices, we need to understand the structure of the MarketWatch website. This involves examining the HTML to identify the specific elements that contain the data we want to extract.
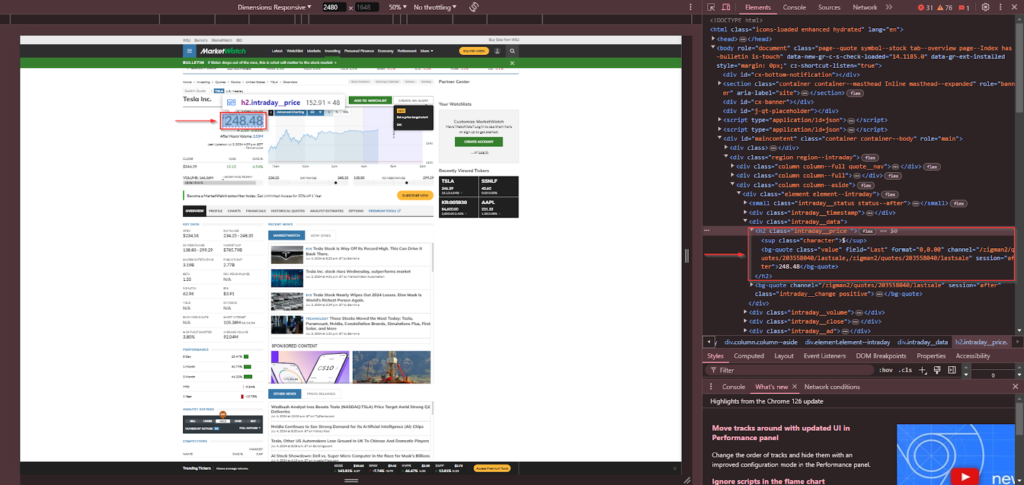
Open your web browser and go to one of the stock pages, such as Tesla’s stock page. Right-click on the stock price on the page and select “Inspect” or “Inspect Element.” This will open the browser’s developer tools and highlight the HTML element containing the stock price.
The main stock price is located within a <bg-quote> tag with the class value inside a <h2> tag with the class intraday__price.
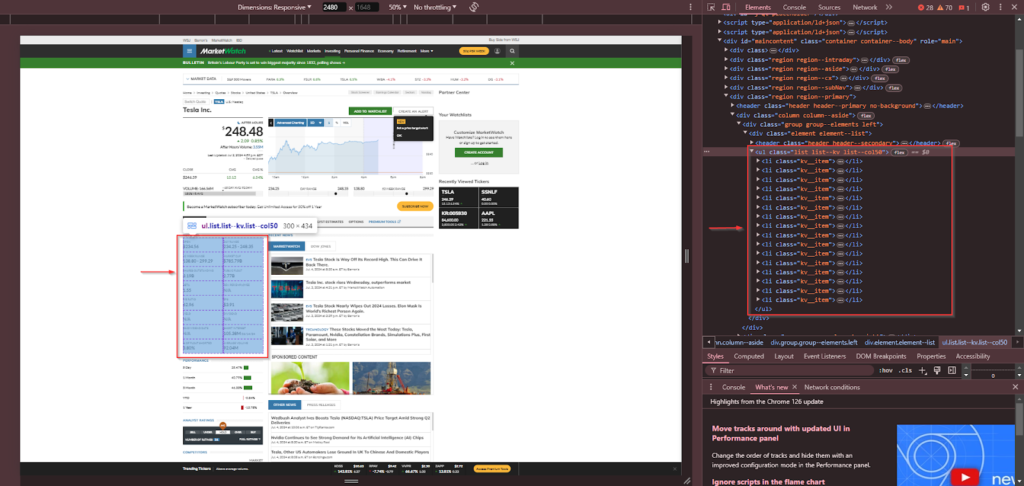
Additional data in the key data section, such as open price, high/low, etc., is found within <li> tags with the class kv__item.
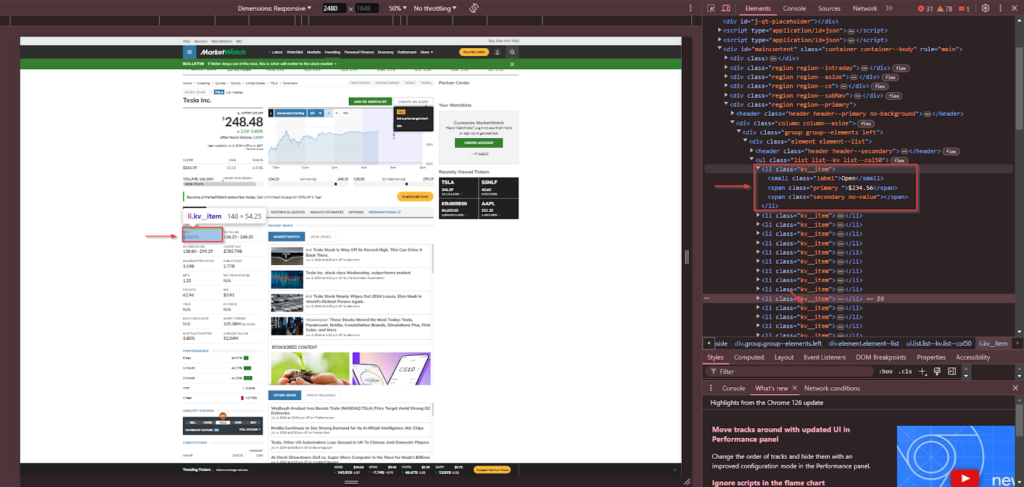
The list items in the key data section contain a <small> tag with the class label for the label and a <span> tag with the class primary for the value.
Now that we have identified the relevant HTML elements, you can use BS4 to extract the data. Here’s a basic example to get you started:
from bs4 import BeautifulSoup
import requests

# Function to get page content
def get_page_content(url):
    response = requests.get(url)
    return response.content

# URL of the Tesla stock page
url = 'https://www.marketwatch.com/investing/stock/tsla?mod=search_symbol'

# Get page content
page_content = get_page_content(url)

# Create a Beautiful Soup object
soup = BeautifulSoup(page_content, 'html.parser')

# Find the HTML element containing the main stock price
main_price = soup.find('bg-quote', class_='value').text

# Find additional stock data
additional_data = {}
for item in soup.find_all('li', class_='kv__item'):
    label = item.find('small', class_='label').text
    value = item.find('span', class_='primary').text
    additional_data[label] = value

# Print the stock price and additional data
print(f"Tesla Stock Price: {main_price}")
for key, value in additional_data.items():
    print(f"{key}: {value}")
Scraping at a Scale
For this project, we’ll be scraping stock prices for three companies: Apple, Samsung, and Tesla. However, any real-life project will likely require scraping data for many more stocks, which can quickly become complex and resource-intensive. Here’s where ScraperAPI becomes crucial.
ScraperAPI helps you scale your scraping efforts and maintain constant and uninterrupted data collection in real-time. It handles IP rotation, solves CAPTCHAs, and ensures your requests are not blocked, allowing you to focus on data extraction without worrying about the technicalities of web scraping at scale.
Benefits of ScraperAPI
Using ScraperAPI offers several advantages:
- IP Rotation: Automatically rotates IP addresses to avoid detection and blocking.
- CAPTCHA Solving: Handles CAPTCHAs seamlessly, allowing for uninterrupted scraping.
- Geolocation Targeting: Enables requests from different geographic locations, which is helpful for region-specific data.
- Browser Simulation: Simulates browser behavior to bypass anti-scraping mechanisms.
Integrating ScraperAPI
First, you’ll need to create a ScraperAPI account to access your API key and get 5,000 free API credits.
Once you have your API key, you can use ScraperAPI to handle your web requests. Here’s how you can do it:
Step 1: Install and Import the Required Libraries
First, install and import the necessary libraries:
- requests: Used to make HTTP requests.
- datetime: Used to store the current date when saving our data.
- csv: Used to store our data in a CSV file.
- BeautifulSoup from bs4: Parses HTML content.
Install these libraries if you haven’t already:
pip install requests beautifulsoup4
Next, import the libraries in your Python script:
import requests
from bs4 import BeautifulSoup
import csv
from datetime import datetime
These libraries will help us fetch web content, parse HTML, manage date and time, and save our data in CSV format.
Step 2: Set Up ScraperAPI
Next, define the ScraperAPI URL and your API key. Replace ‘YOUR_SCRAPERAPI_KEY’ with your actual ScraperAPI key.
# ScraperAPI settings
SCRAPERAPI_URL = 'http://api.scraperapi.com'
SCRAPERAPI_KEY = 'YOUR_SCRAPERAPI_KEY'
Step 3: Define a Function to Get Page Content
After that, create a get_page_content() function that takes a stock symbol as an argument, constructs the URL for the stock page, and uses ScraperAPI to fetch the page content.
def get_page_content(stock_symbol):
    url = f'https://www.marketwatch.com/investing/stock/{stock_symbol}?mod=search_symbol'
    params = {
        'api_key': SCRAPERAPI_KEY,
        'url': url
    }
    response = requests.get(SCRAPERAPI_URL, params=params)
    return response.content
The function constructs the URL for the stock page, sets up the parameters, including the API key and the URL to scrape, and makes a GET request using requests.get. The content of the response is returned.
Step 4: Extract Stock price and Additional Data
Next, create an extract_data() function to extract the stock price and key data from the HTML content.
def extract_data(page_content): soup = BeautifulSoup(page_content, 'html.parser')
Use soup.find() to locate the <bg-quote> tag with the class .value and extract the main stock price.
# Find the HTML element containing the main stock price
main_price = soup.find('bg-quote', class_='value').text
Next, iterate through all <li> tags with the class kv__item, using soup.find_all to locate each key data item. We’ll extract the label from the <small> tag with the class label and the value from the <span> tag with the class primary.
    # Find additional stock data in the key data section
    additional_data = {}
    for item in soup.find_all('li', class_='kv__item'):
        label = item.find('small', class_='label').text
        value = item.find('span', class_='primary').text
        additional_data[label] = value
Return the stock price and the additional data dictionary.
return main_price, additional_data
Step 5: Collect Data for All Stocks and Save to CSV
Next, we will loop through each stock symbol, collect the data, and save it to a CSV file using Python’s csv module.
First, define the list of stock symbols you want to scrape and the headers for the CSV file.
# Example stock symbols
stock_symbols = ['aapl', 'ssnlf', 'tsla']

# List to hold CSV headers
csv_headers = [
    'Date', 'Symbol', 'Price', 'Open', 'Day Range', '52 Week Range', 'Market Cap',
    'Shares Outstanding', 'Public Float', 'Beta', 'Rev. per Employee', 'P/E Ratio',
    'EPS', 'Yield', 'Dividend', 'Ex-Dividend Date', 'Short Interest', '% of Float Shorted',
    'Average Volume'
]
Next, loop through each stock symbol, collect the data using the extract_data() function, and store it in a list of dictionaries.
# CSV file path
csv_file_path = 'stock_data.csv'

# Current date
current_date = datetime.now().strftime('%Y-%m-%d')

# List to hold the collected data
data = []

for symbol in stock_symbols:
    # Get page content
    page_content = get_page_content(symbol)

    # Extract data
    main_price, additional_data = extract_data(page_content)

    # Create a dictionary for the stock data
    stock_data = {
        'Date': current_date,
        'Symbol': symbol.upper(),
        'Price': main_price
    }
    stock_data.update(additional_data)

    # Append to the data list
    data.append(stock_data)
Finally, save the collected data to a CSV file using the csv module.
# Open CSV file for writing
with open(csv_file_path, mode='w', newline='') as file:
    writer = csv.DictWriter(file, fieldnames=csv_headers)
    writer.writeheader()
    for stock_data in data:
        writer.writerow(stock_data)
Here’s the complete code for the scraper:
import requests
from bs4 import BeautifulSoup
import csv
from datetime import datetime

# ScraperAPI settings
SCRAPERAPI_URL = 'http://api.scraperapi.com'
SCRAPERAPI_KEY = 'YOUR_SCRAPERAPI_KEY'

# Function to get page content using ScraperAPI
def get_page_content(stock_symbol):
    url = f'https://www.marketwatch.com/investing/stock/{stock_symbol}?mod=search_symbol'
    params = {
        'api_key': SCRAPERAPI_KEY,
        'url': url
    }
    response = requests.get(SCRAPERAPI_URL, params=params)
    return response.content

# Function to extract data
def extract_data(page_content):
    soup = BeautifulSoup(page_content, 'html.parser')

    # Find the HTML element containing the main stock price
    main_price = soup.find('bg-quote', class_='value').text

    # Find additional stock data in the key data section
    additional_data = {}
    for item in soup.find_all('li', class_='kv__item'):
        label = item.find('small', class_='label').text
        value = item.find('span', class_='primary').text
        additional_data[label] = value

    return main_price, additional_data

# Example stock symbols
stock_symbols = ['aapl', 'ssnlf', 'tsla']

# List to hold CSV headers
csv_headers = [
    'Date', 'Symbol', 'Price', 'Open', 'Day Range', '52 Week Range', 'Market Cap',
    'Shares Outstanding', 'Public Float', 'Beta', 'Rev. per Employee', 'P/E Ratio',
    'EPS', 'Yield', 'Dividend', 'Ex-Dividend Date', 'Short Interest', '% of Float Shorted',
    'Average Volume'
]

# CSV file path
csv_file_path = 'stock_data.csv'

# Current date
current_date = datetime.now().strftime('%Y-%m-%d')

# List to hold the collected data
data = []

for symbol in stock_symbols:
    # Get page content
    page_content = get_page_content(symbol)

    # Extract data
    main_price, additional_data = extract_data(page_content)

    # Create a dictionary for the stock data
    stock_data = {
        'Date': current_date,
        'Symbol': symbol.upper(),
        'Price': main_price
    }
    stock_data.update(additional_data)

    # Append to the data list
    data.append(stock_data)

# Open CSV file for writing
with open(csv_file_path, mode='w', newline='') as file:
    writer = csv.DictWriter(file, fieldnames=csv_headers)
    writer.writeheader()
    for stock_data in data:
        writer.writerow(stock_data)
Step 6: Schedule Scraping on Windows
Stock exchanges open and close at specific times, so your scraper doesn’t need to run continuously. You can schedule scraping tasks to run several times a day, aligning with market hours. This ensures you have up-to-date data without unnecessary API calls.
Here’s how you can schedule your scraping script on Windows using Task Scheduler:
1. Create a Batch File to Run the Python Script
1. Open a text editor (e.g., Notepad) and enter the following command:
python path_to_your_script.py
2. Save the file with a .bat extension, run_stock_scraper.bat.
2. Open Task Scheduler
- Press Win + R, type taskschd.msc, and press Enter.
3. Create a New Task
- In Task Scheduler, click on Create Task.
- In the General tab, name your task (e.g., “Stock Scraper”).
4. Set Triggers
- Go to the Triggers tab and click New.
- Set the schedule for your task (e.g., daily at 09:30, 12:00, and 16:00). You must create separate triggers for each time.
- Click OK to save each trigger.
5. Set Actions
- Go to the Actions tab and click New.
- Set the action to Start a program and browse to your batch file.
- Click OK to save.
6. Finish and Save
- Click OK to create the task.
- Your task will now run the Python script at the scheduled times.
Additional Resources
For scheduling tasks on other operating systems, refer to the following guides:
- macOS: Schedule a Task on macOS
- Linux: Schedule a Task on Linux
By following these steps, you can automate the running of your stock scraper script to align with market hours, ensuring that your data is always current and up-to-date.
Step 7: Create Visualizations in Excel
In this final step, we’ll create visualizations in Excel to analyze stock price trends over time. Although we’ve collected additional data, we’ll focus on creating a line chart using only the Date, Symbol, and Price columns. To simplify this process, we’ll use a Pivot Table to organize the data before plotting the chart.
1. Open the CSV File in Excel
- Open Excel:
- Launch Microsoft Excel.
- Open the CSV File:
- Go to File > Open.
- Navigate to your CSV file (stock_data.csv) and open it.
2. Prepare the Data
- Ensure Data is Properly Formatted:
- Verify that your data is displayed correctly with the Date, Symbol, and Price columns.
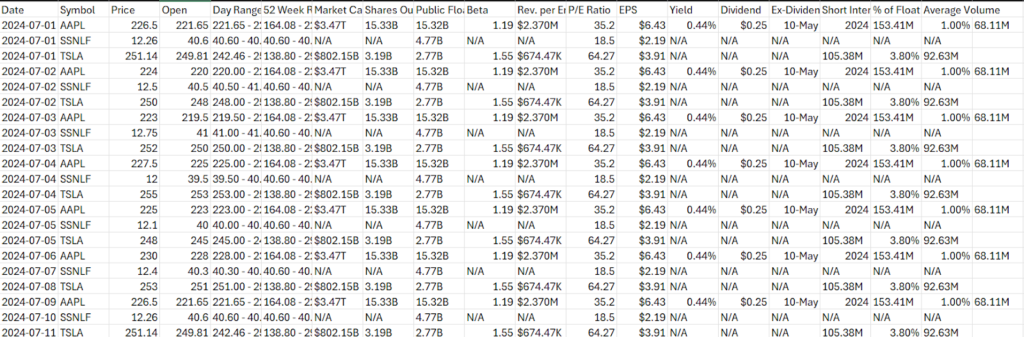
Example data should look like this:
3. Create a PivotTable
- Select Your Data:
- Click anywhere inside the data range, or select the entire range manually, only selecting the Date, Symbol, and Price columns.
- Insert a PivotTable:
- Go to the Insert tab on the Ribbon.
- Click on PivotTable.
- In the Create PivotTable dialog, ensure your data range is selected, and choose to place the PivotTable on a new worksheet.
- Click OK.
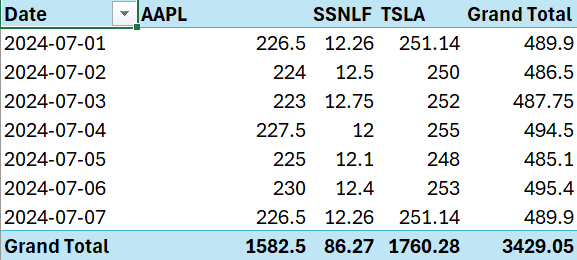
- Configure the PivotTable:
- Rows: Drag the Date field to the Rows area.
- Columns: Drag the Symbol field to the Columns area.
- Values: Drag the Price field to the Values area. Ensure it is set to Sum of Price (usually the default).
Your PivotTable should now look like this, showing dates in rows and stock symbols in columns with their respective prices:
4. Create the Line Chart
- Select the PivotTable Data:
- Click anywhere inside the Pivot Table.
- Ensure you include the headers (Date, AAPL, SSNLF, TSLA).
- Insert a Line Chart:
- Go to the Insert tab on the Ribbon.
- In the Charts group, click on Insert Line or Area Chart.
- Choose the Line chart option.
- Customize the Chart:
- Title: Click on the chart title to edit it. Name it as “Stock Price Trends” using the “Chart Title” option.
- Legend: Ensure the legend clearly shows the different stock symbols.
- Axes: Label the x-axis as “Date” and the y-axis as “Price” by adding the “Axis Title” option to the chart.
- Data Series: Format each data series (each stock) with a different colour or style for better differentiation.
Once you have organized the data and created the line chart, it will clearly show the price trends for each stock over time. This visualization helps you better understand how stock prices change and provides valuable insights for analysis.
Insights from the Line Chart
Based on the dummy data used for this example, this is how the line chart would look:
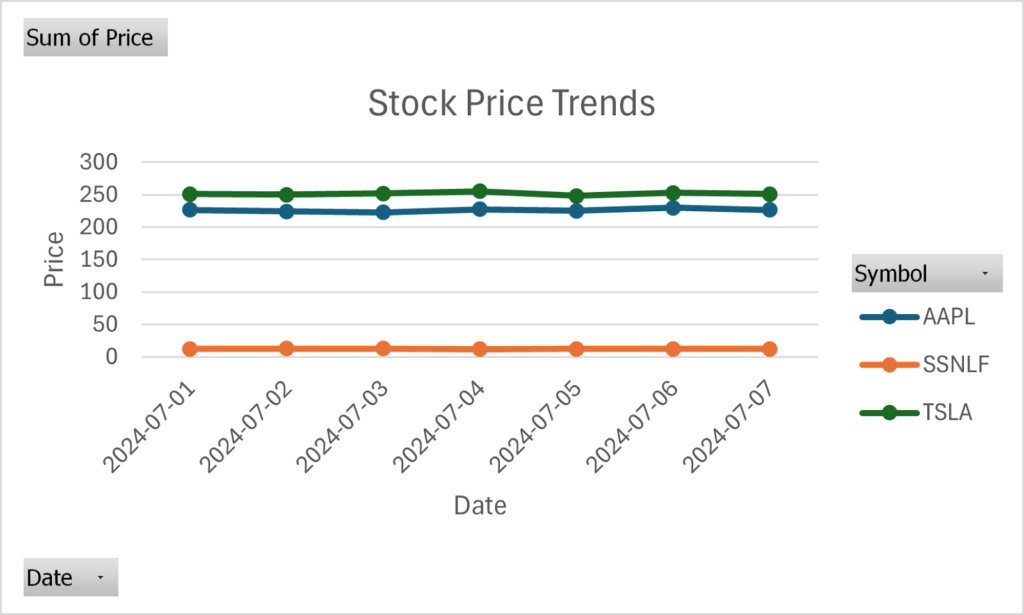
The line chart effectively displays the daily price movements of Apple, Samsung, and Tesla stocks, making it easy to compare and analyze trends. Here are some key insights that can be drawn from such a chart:
- Trend Analysis: See whether each stock is generally going up or down over the selected period.
- Volatility Observation: Notice how much and how often each stock’s price changes.
- Performance Comparison: Compare how each stock is performing relative to the others.
- Critical Events: Spot any sharp price movements corresponding to essential market events or news.
- Support and Resistance Levels: Identify potential price levels where stocks tend to stop and change direction based on past behavior.
Creating visualizations like this enhances your understanding of stock market behavior and helps you make more informed investment decisions. These visual tools also make your article more engaging and easier to understand for readers, helping them see complex data trends more clearly.
Using Excel to visualize stock price trends simplifies data interpretation and provides a clear picture of how stocks perform over time, supporting your analysis and decision-making process.
Conclusion
In this guide, we’ve walked through the entire process of building a custom stock monitoring tool using web scraping. Here’s a summary of what we’ve covered:
- Technical Setup:
- Set up a virtual environment to manage project dependencies.
- Install necessary libraries such as requests and beautifulsoup4.
- Analyzing the Website’s HTML Structure:
- Inspect the MarketWatch stock pages to identify the HTML elements containing the data we need.
- Extracting Stock Data:
- Use Beautiful Soup to extract the main stock price and additional key data from the HTML content.
- Scraping at Scale with ScraperAPI:
- Integrate ScraperAPI to handle web requests, ensuring continuous and reliable data collection.
- Collecting and Saving Data to CSV:
- Loop through multiple stock symbols to collect data.
- Save the collected data to a CSV file using Python’s csv module.
- Scheduling the Scraping Task on Windows:
- Use Windows Task Scheduler to automate the running of your script at specific times of the day.
- Creating Visualizations in Excel:
- Organize the collected data using a Pivot Table.
- Create a line chart to visualize stock price trends over time.
By following these steps, you can automate the process of monitoring stock prices, saving time and effort while ensuring you always have the latest data at your fingertips.
Visualizing this data in Excel makes it easier to understand and analyze stock trends, helping you make more informed investment decisions, not only simplifying data collection and analysis but also enhancing your ability to respond quickly to market changes.
