These days, we take it for granted that you can connect a cheap piece of hardware to a microcontroller and have an amazing debugging experience. Stop the program. Examine memory and registers. You can see and usually change anything. There are only a handful of ways this is done on modern CPUs, and they all vary only by detail. But this wasn’t always the case. Getting that kind of view to an actual running system was an expensive proposition.
Today, you typically have some serial interface, often JTAG, and enough hardware in the IC to communicate with a host computer to reveal and change internal state, set breakpoints, and the rest. But that wasn’t always easy. In the bad old days, transistors were large and die were small. You couldn’t afford to add little debugging pins to each processor you produced.
This led to some very interesting workarounds. Of course, you could always run simulators on a larger computer. But that might not work in real time, and almost certainly didn’t have all the external things you wanted to connect to, unless you also simulated them.
The alternative? Create a special chip, often called a bond-out chip. These were usually expensive and had some way to communicate with the outside world. This might be a couple of pins, or there might be a bundle of wires coming out of the top of the chip. You replaced your microprocessor with the expensive bond-out chip and connected it to your very expensive in-circuit emulator.
For example, the venerable 8051 had an 8051E chip that brought out the address and data bus lines for debugging. In fact, the history of the 8051 notes that they developed the bond-out chip first. The chip was bigger and sold in lower volumes, so it was more expensive. It needed not just connections but breakpoint hardware to stop the CPU at exactly the right time for debugging.
In some cases, the emulator probe was a board that sat between a stock CPU and the CPU socket. Of course, that meant you had to have room to accommodate the large board. Of course, it also assumes that at least your development board had a socket, although in those days it was rare to have an expensive CPU soldered right down to the board.
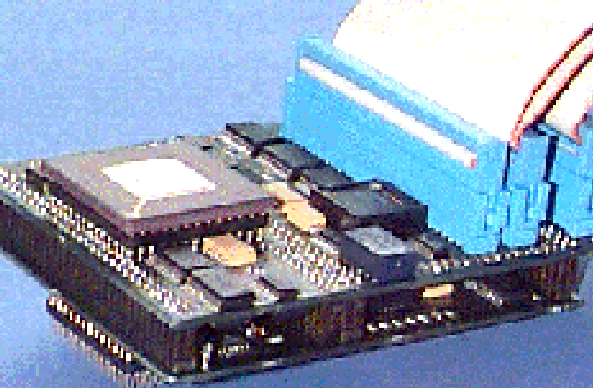
For example, the Lauterbach ICE-68300 here could take a bond-out chip or a regular chip, although it would be missing features if you didn’t have the special chip.
Of course, you can still find in circuit emulators, but the difference is that they almost certainly have supporting hardware on the standard chip and simply use a serial communication protocol to talk to the on-chip hardware.
Of course, if you want an emulator for an old CPU, you have enough horsepower now that you can probably emulate it like with a modern processor, like the IZE80 does in the video below. Then you can incorporate all kinds of magical debugging features. But be careful what you take on. To properly mimic the hardware means tight timing for things like DRAM refresh and a complete understanding of all the bus timings involved.
But it can be done. In any event, on chip debugging or real in-circuit emulation, it sure makes life easier.


This is still a thing for chips that have hard real-time circuitry in them. No point looking at registers after the event.
I still miss some of the features we had with in circuit emulation: Instruction traces that you could walk backward through to go from effect to cause and state machine logic to trigger breakpoints on complex conditions.
part of me is glad there are serious labs with powerful tools but part of me thinks “make debugging easier?? pshaw if it was easy, everyone would do it.” :P
“Of course, you can still find them in circuit emulators”
I think you mean “Of course, you can still find them in in-circuit emulators,” Al.
I remember the Intel ICE for the 80186. It was bigger than a PC.
IIRC, the errata manual for the ‘186 was larger than a PC =))
I used one of those for the 80286 processors on the IBM PS2 boards. Used it write a wee memory debug program that jumped in and out of protected mode. Was able to step though the code one instruction at a time. Lovely
The parallel port or serial port copy protection dongles, or the emulator software, where a pain. None of this stuff was ever fun to work with. As soon as the board was up, good bye emulator. Rather deal with printf and io pin toggles than that crappy, always behind the times, always buggy, emulator software.
When we first started doing C++ in 68020/30/40 embedded systems, the go to option was to slap a logic probe on the chip, set up a trigger that would catch the condition of interest, coax the system into misbehaving, use an appropriate 680×0 disassembler (?) to turn the captured sequence into an execution trace, then use a copy of the firmware memory map to see the assembly code decorated with symbols, and from there figure out which lines of c++ corresponded to which lines of assembly code.
Note that an issues had to be fairly reproducible in order to be caught using this method .. you had to lay the trap in a place where you knew for sure the bug would set foot.
It’s almost impossible to imagine doing something with so many intricate, manual steps now .. in fact, even in the bad-old days it was sort of an option of last resort .. basically, it was used when there was no sane explanation for problem
For example, we found a number of bugs in the Microtec C (and later, c++) compilers that we were using .. so basically, you would find the errant piece of code, and then re-write it with syntactical tweaks that would preserve the logic, and not confound the compiler.
In any case, good times (ha!) .. but, seriously .. it did help sharpen debugging chops .. in part because we were willing to think very hard before dragging out the logic analyzer, and in part because the debugging process really gave one’s executive function capacity a serious workout.
(?) “disassembler” may be the wrong term .. we’re going back like 30 years here ..
i love that! a memory access trace
I think term you are looking for is “inverse assembler” , at least that’s what HP/Agilent called it
“This might be a couple of pins, or there might be a bundle of wires coming out of the top of the chip.”
That link discusses a chip that accepts piggyback memory. Those pins are useless for in-use debugging.
Well, on an 8051, and presumably a few other microcontrollers, they actually bring the internal address and data bus to the outside. On the 804x and 805x microcontrollers, there is the /EA pin, which can bring the address and data busses to the “outside”. But it costs you a whole bunch of gpio pins, so it’s not useful in an embedded system.
The TMS1000 was in a similar kind of situation. It didn’t even have the option to switch between using internal or external memory, they just had versions with fewer or more pins, and the versions with more pins had the address and data bus external.
Come to think of it now, the TMS1000, 804x and 805x were all ‘Harvard Architecture’. This was probably an issue for all Harvard Architecture devices, which probably includes a whole bunch of DSPs too. Because why would you bring out the instruction bus? The data bus is what it’s all about, with HA devices.
Theoretically, you could also use a ram instead of a rom and have software breakpoints through some tricky use of the HLT instruction, or whatever instruction halts the CPU. Very tricky, of course, but possible. You can also run a monitor/emulator alongside the CPU to keep track of register contents, etc.
So basically, there IS some use to them. But it’s all very crude, of course.
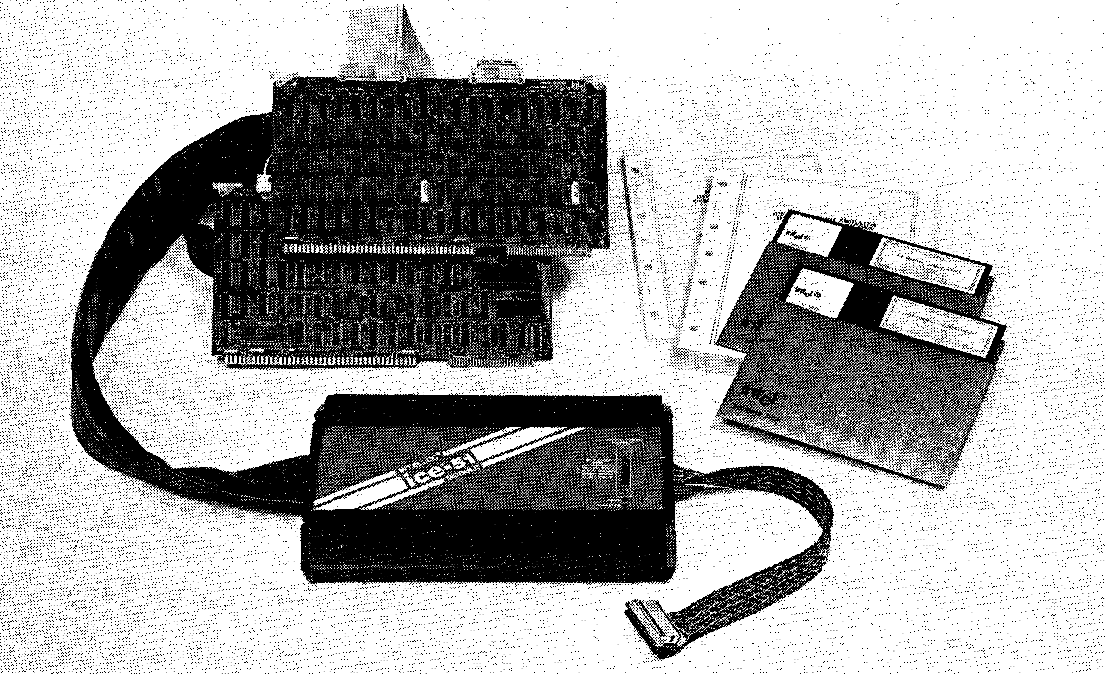
Back in the 80’s I used a very clever device called “PROM-ICE”. Instead of replacing the processor it plugged into the socket for the PROM. Your custom code would be loaded into the PROM emulator. To create a breakpoint, the device would substitute its own code at the breakpoint. This would reroute the processor to a monitor routine through which you could read/write all the registers and memory. The fancier ones also had real-time trace capabilities. Even without the debugging capabilities it was far easier to try a new code version than physically swapping out the PROM IC and sticking it in the UV eraser.
The same device could be used for different processors because the hardware only emulated the PROM and the processor specific bits were in software.
A classic ROM emulator. Had one in the 90s. Single step and multiple breakpoints in memory were useful but the micros were so simple in those days. So much better nowadays with JTAG and modern IDEs.
Basically, the PiStorm can also be seen as an in-circuit emulator. :)
I used an ICE on the Sega Master System, when tracking null pointer exception (not actually an exception since it was a Z80) you could step back up to 4095 instructions to find how it got into that state. It was very useful since I had interrupts on the screen and had 224 cycles per scanline, so any regular type of debugging would be impossible.